10 Best Software for Heatmaps in 2025

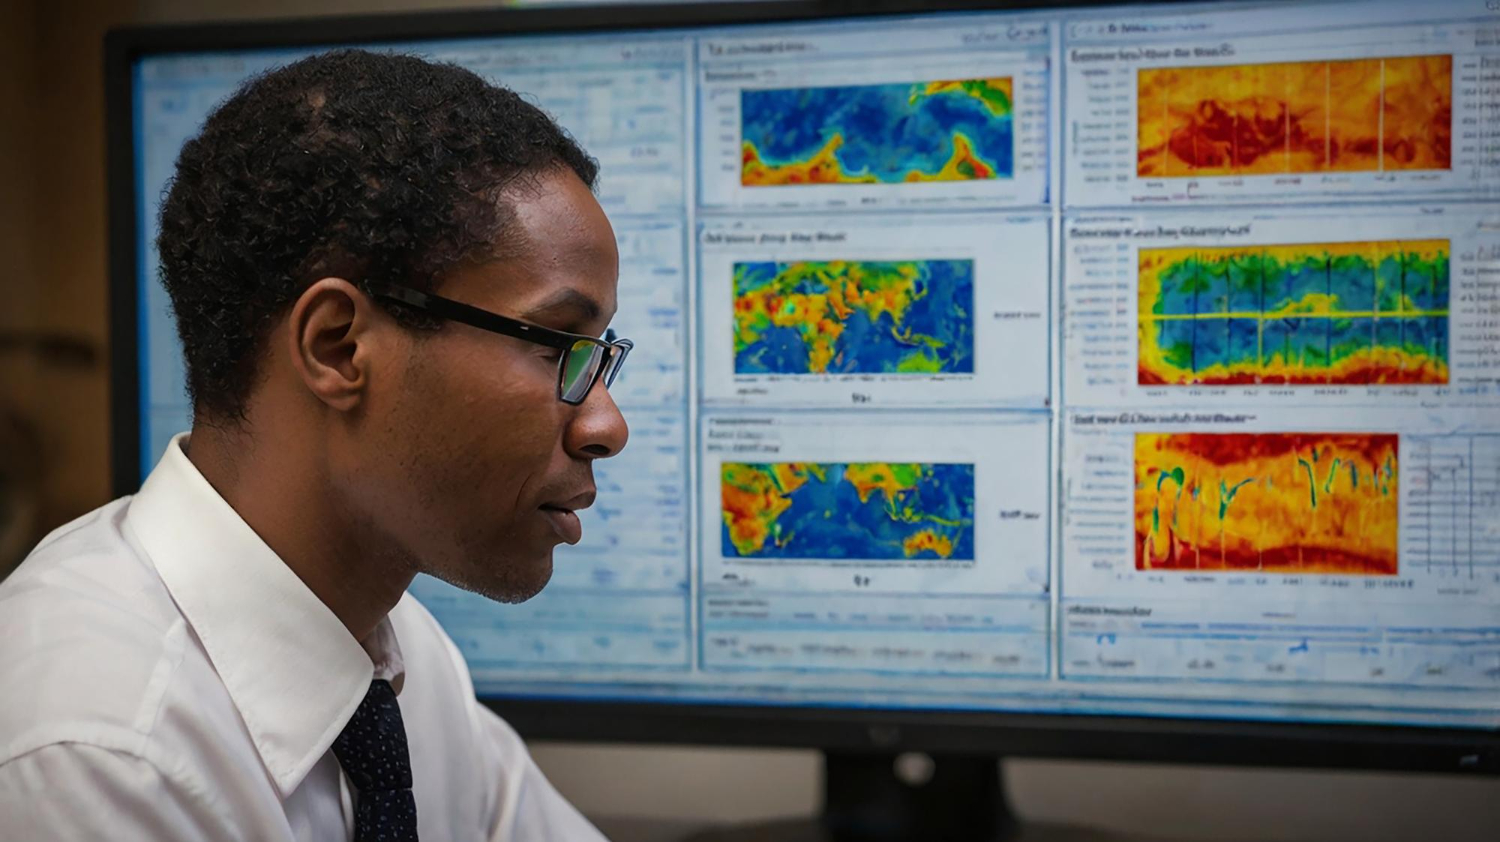
What Are Heatmaps and Why Should You Care?
A heatmap takes every click, tap, and scroll on a page and turns it into a color-coded overlay: red where attention piles up, blue where it thins out, nothing at all where visitors never look. It’s the fastest way to see the gap between the page you designed and the page people actually use.
That gap matters more than most analytics dashboards let on. A conversion report tells you a form is losing 40% of visitors before submission. A heatmap tells you why: everyone stops at field six, or nobody scrolls far enough to see the submit button in the first place. Session recordings and scroll maps turn a vague number into a specific, fixable problem, which is the whole reason this category of tool exists.

How to Pick the Right Heatmap Tool for Your Site
The category is crowded enough that picking by name recognition alone will get you a tool that doesn’t actually fit your site. Start with two questions instead: how much traffic are you working with, and what decision are you trying to make?
Low-traffic sites need a tool with no sampling, meaning it records every visitor rather than a percentage, since a sampled heatmap on a page with two hundred monthly visitors won’t have enough data to mean anything. High-traffic sites can tolerate sampling in exchange for lower cost, but should prioritize segmentation, the ability to filter heatmaps by device, traffic source, or user type, since an aggregate heatmap on a busy page tends to blur real patterns into noise. Beyond that, check for session recording, GDPR-compliant data handling if you serve EU visitors, and whether the tool integrates with analytics you already run. Price matters too, but it’s the last filter, not the first.
There’s a data-volume trap worth naming here too: a heatmap built from fifty sessions can look convincing and still be wrong. A single unusual visitor, someone testing every link on the page out of curiosity, or a bot that slipped past your filtering, can distort a small sample into a pattern that isn’t really there. Wait for real volume before you redesign anything based on what a heatmap is telling you.
Cross-device behavior deserves a specific mention too, since it’s the piece teams most often skip. Mobile and desktop visitors interact with the same page very differently: thumb reach shapes where mobile clicks land, while desktop clicks cluster around whatever’s visible without scrolling on a wider viewport. A single blended heatmap covering both device types will average those two patterns into something that describes neither one accurately. Split your heatmaps by device before drawing any conclusions, and expect the redesign priorities that come out of each to look genuinely different.
10 Best Heatmap and Session Recording Tools for 2025
1. Mouseflow
Mouseflow covers more heatmap types than most competitors bother to build: click, movement, scroll, attention, geographic, and a live view that updates in real time. Each one answers a slightly different question, movement heatmaps catch where the cursor lingers even without a click, which often reveals confusion a click map alone would miss entirely.
Session replays, funnel analysis, and form analytics round out the platform, so you can watch exactly where a specific visitor hesitated before abandoning a form, then check whether that’s a pattern across dozens of sessions or a one-off. Best for: teams that want the full toolkit, six heatmap types plus replays plus funnels, in one subscription rather than stitching together separate tools. Watch out for: the breadth of features means a real onboarding period before you’re using the platform efficiently.
2. Hotjar
Hotjar built its reputation on being the easiest heatmap tool to actually start using, and that’s still true. Heatmaps, session recordings, on-site polls, and post-visit surveys all live in one dashboard, which means you’re not just seeing where visitors got stuck, you can ask them directly why.
The free tier is genuinely usable for small sites, not just a trial funnel, which makes Hotjar a reasonable first heatmap tool for anyone who hasn’t used one before. Now operating under Contentsquare’s ownership since a 2021 acquisition, it continues to run as its own product with its own pricing and interface. Best for: teams new to heatmaps who want a low learning curve and the option to pair visual data with direct visitor feedback. Watch out for: the free tier caps monthly sessions, so a busy site will hit that ceiling faster than expected.
3. PostHog
PostHog took a different route into this category: it started as an open-source product analytics platform and expanded into session replay, heatmaps, feature flags, and A/B testing under one roof. You can self-host it for full data control or use its cloud version, and the free tier is generous enough that small teams often never need to pay.
What sets it apart is the combination: heatmaps sit next to funnel analysis, cohort tracking, and feature flag data in the same tool, so a UX finding and a product usage trend are one click apart instead of living in separate dashboards. Best for: technical teams that want heatmaps bundled with deeper product analytics, and the option to self-host for data control. Watch out for: self-hosting means your team owns setup and maintenance, not a one-click signup.
Also Read: Best Software for PPC Campaign Management
4. FullStory
FullStory positions itself less as a heatmap tool and more as a full behavioral record of every session, and the “frustration signals” feature backs that up: it automatically flags rage clicks, dead clicks on non-interactive elements, and erratic mouse movement that usually signals confusion. Those signals surface problems a standard heatmap would leave you to spot manually.
That depth makes FullStory well suited to complex apps and enterprise sites where a UX team needs to search across thousands of sessions for a specific pattern, rather than eyeballing a handful of recordings one at a time. Best for: enterprise teams debugging complex flows who need to search session data at scale, not just view individual replays. Watch out for: pricing scales with the depth of the platform, so it’s a heavier commitment than a simple heatmap add-on.
5. Crazy Egg
Crazy Egg keeps its interface simple enough that a marketer with no design or dev background can run a real experiment without filing a ticket. Beyond standard click and scroll heatmaps, its confetti report breaks clicks down by traffic source, showing whether visitors from a specific campaign behave differently than organic traffic on the same page.
The built-in A/B testing tool means you can act on a heatmap finding, say, a CTA getting ignored, by testing a variant directly in Crazy Egg rather than exporting data to a separate testing platform. Best for: marketers who want to go from heatmap insight to a live A/B test without switching tools or waiting on developer time. Watch out for: the deeper behavioral analytics found in FullStory or Mouseflow aren’t really Crazy Egg’s focus.
6. Lucky Orange
Lucky Orange records every session without sampling, which is a meaningful advantage for smaller sites where a sampled tool wouldn’t gather enough data to be useful. Form analytics, conversion funnels, and heatmaps come standard, and a built-in live chat lets you talk to a visitor while they’re still on the page.
That chat feature is what separates Lucky Orange from most of this list: instead of only inferring why someone abandoned a cart, you can message them in the moment and ask. Best for: e-commerce and service sites that want to combine passive behavioral data with the option for real-time visitor conversations. Watch out for: the live chat feature only helps if someone’s actually staffing it during traffic hours.
7. VWO (Visual Website Optimizer)
VWO treats heatmaps as one input into a larger experimentation platform rather than the main event. A/B testing, session recordings, segmentation, and personalization all connect, so you can identify that mobile visitors from a specific region are struggling with a page, then serve that exact segment a tailored variant and measure the lift.
That’s a heavier setup than most of the tools above, and it’s built for teams that already think in terms of structured experiments, not just visual curiosity about where clicks land. Best for: conversion teams running structured, segmented experiments rather than a one-off heatmap review. Watch out for: the platform rewards teams that already have a testing process; it won’t build one for you. For a broader look at testing platforms in this space, see our roundup of the best A/B testing software.
8. Inspectlet
Inspectlet covers the standard click, scroll, and session replay set, plus a gaze-prediction feature that estimates visual attention based on mouse trajectory rather than requiring actual eye-tracking hardware. That’s a reasonable proxy for attention on pages where you want a rough read on what draws the eye before a click ever happens.
It’s a solid fit for teams redesigning a specific page rather than running an ongoing behavioral analytics program, since its strength is granular, page-level insight rather than the funnel and cohort tooling found in bigger platforms. Best for: a focused redesign project on one or two key pages rather than an always-on analytics setup. Watch out for: gaze-prediction data is an estimate, not literal eye-tracking, so treat it as a directional signal rather than hard fact.
9. Microsoft Clarity
Microsoft Clarity remains the strongest free option in this entire category, not a stripped-down trial but genuinely unlimited session recordings and heatmaps with no watermark and no artificial data cap. For a tool that costs nothing, that’s a hard combination to beat.
Native integration with Google Analytics means Clarity’s session data can sit alongside your existing traffic reports rather than requiring a separate login and a mental context switch. Best for: anyone who wants enterprise-grade heatmaps and session replay without a subscription, full stop. Watch out for: it lacks the A/B testing and CRO-specific features that paid platforms like VWO or Crazy Egg build around their heatmaps.
10. LogRocket
LogRocket earns its spot on this list by connecting behavioral data to technical performance in a way none of the marketing-focused tools do. A heatmap might show low clicks on a CTA; LogRocket can tell you whether that’s a design problem or a JavaScript error silently breaking the button for a subset of users.
That combination makes it the natural pick for product and engineering teams who need to fix both the UX problem and the underlying bug in the same investigation, rather than handing a heatmap screenshot to a developer and hoping they find the cause. Best for: product and dev teams who need session replay tied directly to error logs and performance metrics. Watch out for: it’s built for a technical audience, so a purely marketing-focused team may find the extra performance data unnecessary.
Quick Comparison
| Tool | Best For | Standout Feature | Pricing |
|---|---|---|---|
| Mouseflow | Full behavioral toolkit | Six heatmap types in one platform | Free tier, paid plans scale up |
| Hotjar | Beginners | Heatmaps plus polls and surveys | Usable free tier, paid plans available |
| PostHog | Technical/product teams | Heatmaps bundled with product analytics | Generous free tier, self-hostable |
| FullStory | Enterprise debugging | Automatic frustration signal detection | Enterprise pricing |
| Crazy Egg | Marketers | Confetti report by traffic source | Paid plans, free trial |
| Lucky Orange | E-commerce | No sampling, plus live chat | Free tier, paid plans available |
| VWO | Structured experimentation | Segmentation and personalization | Enterprise-focused pricing |
| Inspectlet | Focused page redesigns | Gaze-prediction heatmaps | Free tier, paid plans available |
| Microsoft Clarity | Zero-budget teams | Unlimited recordings, completely free | Free, no paid tier |
| LogRocket | Product and dev teams | Session replay tied to error logs | Free tier, paid plans scale with usage |

From Heatmap to Actual Change
A heatmap sitting unread in a dashboard changes nothing. The tools above only earn their subscription cost if someone actually reviews the data on a schedule, say, checking your three highest-traffic pages once a month, and turns each finding into a specific test: move the CTA above the fold, shorten the form, rewrite the headline. Heatmaps identify the problem. They don’t fix it for you.
Pairing a heatmap tool with structured testing closes that loop. Once you’ve spotted a pattern, run it through proper A/B testing software rather than assuming your fix worked just because it felt right, and if the underlying goal is broader conversion lift rather than a single page fix, our roundup of conversion rate optimization software covers the wider toolkit. For teams still working through page layout itself before testing begins, our guide to the best UI/UX design software is worth a look too.
Common Questions About Heatmap Tools
What happened to Smartlook? It used to be a common recommendation.
Smartlook was acquired by Cisco and is being wound down as a standalone product, folded into Cisco’s Digital Experience Analytics within Splunk Observability Cloud. New subscriptions stopped being sold in mid-2026, with existing contracts running through their renewal dates before the platform is fully retired. Anyone evaluating tools today should look at Hotjar, Mouseflow, or PostHog instead.
Do I need session recordings if I already have heatmaps?
They answer different questions. A heatmap shows aggregate patterns across many visitors at once, useful for spotting a trend. Session recordings show one specific visitor’s actual path through your site, useful for understanding a single confusing moment in detail. Most serious optimization work uses both: heatmaps to find where to look, recordings to see exactly what happened there.
Will installing a heatmap tool slow down my site?
Any tracking script adds some load, but the reputable tools on this list are built to load asynchronously so they don’t block your page from rendering. The bigger performance risk is running multiple overlapping analytics tools at once rather than any single well-built heatmap script on its own.
How much traffic do I actually need before a heatmap becomes meaningful?
There’s no universal number, but a rough rule of thumb: aim for at least a few hundred sessions on a page before treating a heatmap pattern as reliable. A page getting ten visits a week will take a while to build up a heatmap worth acting on, and in that case, session recordings, watching individual visits in full, often tell you more per visitor than an aggregate heatmap would at that low a volume.
Choose, Integrate, Iterate
Heatmaps won’t tell you what to build next on their own. What they do is replace guesswork with evidence: instead of arguing in a meeting about whether a CTA is visible enough, you pull up the click map and see for yourself. From free options like Microsoft Clarity to full experimentation platforms like VWO, there’s a tool here for practically any budget and team size.
Pick one, install it on your highest-traffic pages first, and give it two to four weeks before drawing conclusions. Patterns that look real after three days of data often aren’t; patterns that hold up after a few hundred sessions usually are worth acting on.
Keep the loop tight and repeatable rather than treating this as a one-time audit. Install the tool, watch a batch of real sessions, pick the single biggest friction point, fix it, then check whether the fix actually moved the numbers before hunting for the next problem. Sites that run this cycle every month or two tend to compound small wins into a meaningfully better conversion rate over a year. Sites that install a heatmap tool once, glance at it for a week, and forget about it get roughly the value of doing nothing at all.
Interesting Reads:
Best Software for Competitor Analysis